Welcome to part 3 in our series of Business Analysis topics. Today’s topic is the Cause and Effect Analysis process.
When confronted with a problem where the cause is not easily apparent, you need a process to be able to identify the correct cause of the problem and not just a symptom. You want to be able to look at all possible causes, prioritize them, and be confident that you are addressing the correct cause(s).
Cause and Effect Analysis helps to identify the potential causes of the problem in question. It provides a technique to help identify all the contributing factors that are leading to the cause of the problem. The end result is a list of potential causes that can be further investigated to get to the root cause of the issue.
Cause and Effect Analysis is sometimes referred to as a “Fishbone” diagram because the end result looks like a fishbone.
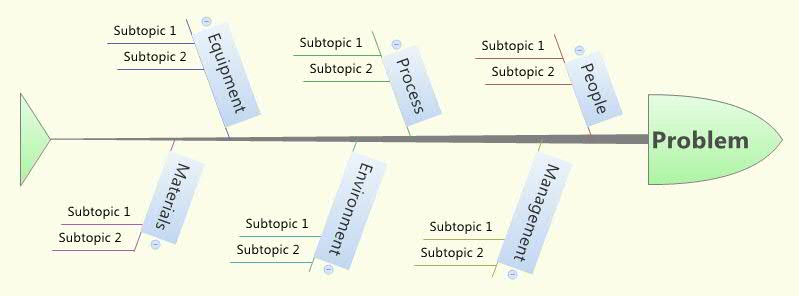
The image above comes from a template for the Cause and Effect diagram in the XMind mind mapping application. Check out the link to learn more about XMind, if you have an interest in mind mapping software.
Using Cause and Effect Analysis
Similar to the Affinity Diagram, the Cause and Effect process works best in a brainstorming session with subject-matter experts (SMEs) attending and interacting together. It may also be useful as an individual exercise to better understand a problem, but it won’t be as effect as a team brainstorming session.
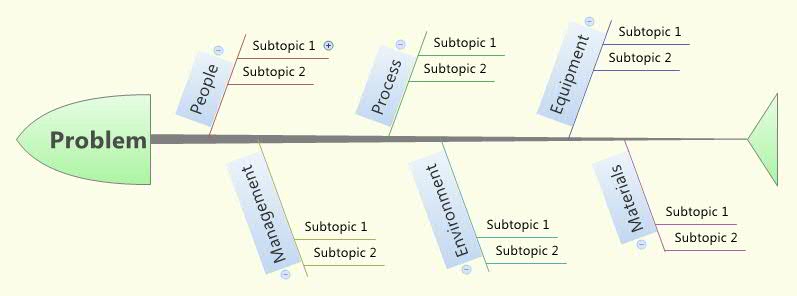
Step 1 – The Cause and Effect process begins with identifying and writing the problem on the left or right side of the paper/board/screen. Then attach a long horizontal line (the backbone of the fish) to the problem description.

You can use a rectangular box or no box at all for the problem description – whatever works best for you. I am staying with the “fishbone” analogy for this article so my description “box” is a sideways shield to look like a fish head.
Be sure to write the problem as clearly and descriptively as possible. Everyone participating in the exercise should clearly understand the problem.
Step 2 – Identify the major categories associated with the problem. If you have preceded the Cause and Effect analysis with an Affinity Diagram, you can use the titles of the groups from that exercise.
Another option is to categorize by common major functions. As you can see below, the XMind template uses People, Process, Equipment, Management, Environment, and Materials as the main problem categories.

You may also see categories for the Cause & Effect diagram be identified as:
- Measurement
- Method
- Man
- Machine
- Material
- Environment
Use these category examples as guidelines, but don’t limit yourself. The categories for Cause and Effect Analysis can be anything, so be sure to use whatever is appropriate to the problem you are trying to solve. For that reason, I would recommend to perform an Affinity Diagram to identify the categories prior to the Cause and Effect exercise.
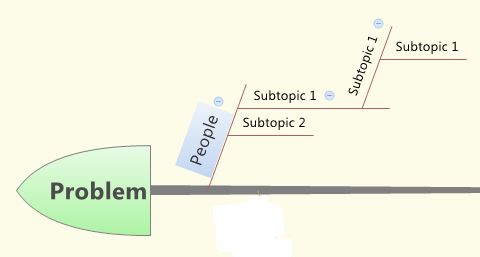
Step 3 – Once you have all the correct main categories of the problem identified, you can begin to brainstorm possible causes related to each of them. In the diagram, these are identified as spurs to the main categories:
There can be as many spurs off of the main categories so that the specific cause is appropriately identified.
As you move through this step, a few things to remember:
- Move past symptoms and get to the true cause
- You may want to use the “5 Whys” technique to help you get to true root cause
- The technique states that to get to the true root cause, you need to answer the question “Why?” 5 times
Step 4 – You should now have a diagram displaying all of the possible causes you can identify for the problem.
At this point the cause may be apparent to you and the team. Otherwise, you probably will have a few items you will need to investigate further. Based on input from the team, identify the critical few variables from the diagram that are the most likely culprits to the problem. This will usually be no more than 2-3 items from the diagram. Highlight the items in the diagram and get sub-teams to investigate them further.
Let’s go through a quick example.
For our example, the team has experienced lower than expected sales volume. So we identified the problem and went with the six main common categories for cause and effect – People, Process, Equipment, Management, Environment, and Materials.
After going through the brainstorming exercise this is what our Cause and Effect diagram looks like:
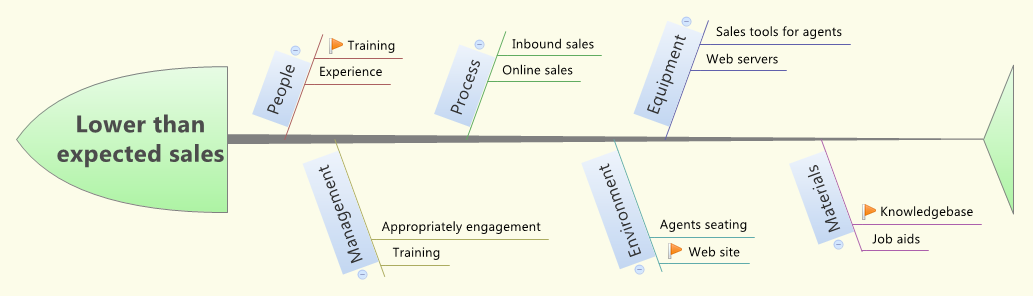
When the team looks at this diagram, they determine that three areas need to be looked at in more detail – highlighted with flags in the diagram:
- Training
- Is the current training for our sales agent adequate?
- Knowledgebase
- Are the Knowledgebase articles clear and accurate?
- Web site
- Does the sales area of the web site properly describe our products and provide an easy way to purchase?
Sub-teams are assigned to further investigate each of these areas. The sub-teams can use the Cause and Effect analysis or other tools as needed.
Well, that’s Cause and Effect analysis. Let me know your thoughts about this topic.
As always, if you need help with Cause and Effect analysis or the next steps, please contact us for assistance.
0 Comments
Leave A Comment